Emlid Reach RS Guide #5 - Post Processing Rover Logs for PPK
Survey
Author: Chad Hill
Revision date: August 2018
This guide is intended to help you post process log data from a pair of Reach RS units acting as Base Station and Rover in order to produce corrected point survey data. This process is known as Post Processed Kinematic survey or PPK.
Overview of this
guide:
1. Introduction
2. Before Fieldwork
3. Setup and data collection in the field
4. Download Logs
5. Download precise clock data and RTKLib
6. Process data in RTKlib
7. Check Solution
8. Troubleshooting
1. Introduction
When using a pair of Reach RS units in RTK mode, the simplest way to record points is to use the onboard ReachView Survey tab (see guide #1). In this mode, with the base station operating on a known location, with good radio communication, and with continuous and reliable “fixed” solutions, you will have useable and accurate data in .csv or .shp format at the end of the survey. However, in many instances it can be challenging meet all three requirements (radio link, continuous satellite reception, and known base station location), especially in challenging field conditions. In cases where one or more of those conditions cannot be met, it may be possible to do the survey rapidly with NO communication between the rover and the base and then post process the data to get good and accurate results. For the Emlid Reach RS system, this process uses the open source software package RTKlib (and specifically the application RTKPost) to do the post processing.
Unfortunately, RTKPost is not beginner friendly and can be frustrating for new users. The software does not provide feedback about why your processing might have failed and there are many variables that can cause your processing to fail or have poor results. This walkthrough provides instructions for RTKLib settings for straightforward processing of a base station and rover log, but you are likely to run into problems with real world data. There is a troubleshooting guide at the end with some suggestions for options you can experiment with to help improve your results.
2. Before Fieldwork
The hardware that will be required for using a base station and rover together includes:
1. 2x Reach RS unit
2. 1x Survey Tripod
3. 1x 2m GNSS survey rod
4. 1x Tribrach w/optical plummet
5. An Android or Windows Tablet for accessing ReachView
Before going to the field, ensure that your reach unit and tablet are charged. The reach is charged via a micro USB port on the front of the unit. There should also be a micro USB cable in the storage case. The Emlid should be charged completely after being plugged into any USB port for a few hours. The internal battery will power the Reach RS for many (up to 30) hours of continuous operation.
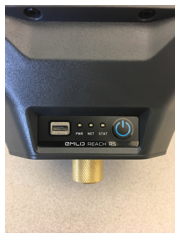
Front panel of the Reach RS: USB charge port at left, 3 status LEDs in the middle, power button on the right. Below is the brass survey tripod adaptor.
3.
Setup and data collection
For this type of survey you need both the Rover and Base Station to be recording logs, and to record point data in the ReachView App in the rover, but you do NOT need the rover and base station to be communicating. You CAN allow the rover and reach to communicate (for instance if you have set up your rover following guide #1) but it is not necessary and it will not make a difference to the final result. The general setup steps in the field will be:
1. Setup the base station and make sure it is logging data
2. Setup the Rover and ensure it is logging data
3. Record survey points using the ReachView Survey tab
First, mount the Reach RS base station to the tribrach using the brass adaptor, and ensure that the reach is level and directly over a survey mark using the leveling screws and optical plummet of the tribrach. There are two options for the survey mark here. You can use a previously known point that you have coordinates for, OR you can later use the base station log data to FIRST post process the base station position using CORS data and then post process the survey data using the new base station position. In that case you would follow Guide #3 to establish a base station position BEFORE following the post processing walkthrough described here for the rover data:
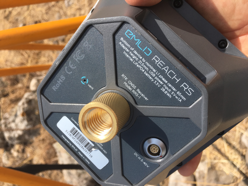
The bottom of the Reach RS, this is the location to measure to when recording HI.
Be sure to screw the external radio antenna into the bottom of the Reach RS before turning the device on!
Measure the distance (in meters) from the survey mark to the base of the receiver using a hand tape. Add 6.5mm to this measurement to get the height of the instrument (HI). Note this measurement, we will need to enter it below.
All setup of the Reach RS is accomplished
via a Wi-Fi connection and through a browser window or the “ReachView” App for
iOS and Android. The Reach RS can either connect to an external local Wi-Fi
network or generate its own Wi-Fi hotspot. The “ReachView” app can be
downloaded here for iOS:
https://itunes.apple.com/us/app/reachview/id1295196887?mt=8
Or here for Android:
https://play.google.com/store/apps/details?id=com.reachview&hl=en
N.B. You will only be able to access your Reach via
the Android and iOS apps if you have already updated your Reach RS to firmware
2.8.0 or higher. Please see the “initial setup” guide for directions on how to
connect the Reach to the internet to update firmware.
For the type of survey described here you do NOT need the base station to access the internet, so you can allow it to generate its own wifi hotspot. If you have previously configured your Reach to utilize the hotspot in your phone, you should turn your phone hotspot off so that the Reach does not log into it. When you turn on the Reach RS, it will first look for Wi-Fi networks it knows, and then create its own hotspot if it finds none. Turn on the Reach by pressing the power button for 3 seconds. The front LED lights should flash. After a few moments, the blue “Net” LED light should come on solidly to indicate the Reach RS has initiated the internal hotspot (if the blue “net” light is blinking, the Reach RS has instead logged on to an external Wi-Fi network). On your mobile device, search for available Wi-Fi networks and look for the one that is called either “reach:xx:xx” or, if you have renamed your Reach during the initial setup, it should have that name plus “:xx:xx”. In the example below, the Reach network is available as “DartmouthBase:f7:a5”. Log on to that network using the password “emlidreach” unless you previously selected a more secure password.
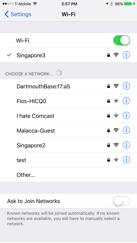
An iPhone Wi-Fi network selection window, showing “DartmouthBase:f7:a5” as an available network
Once connected to the Reach hotspot, open the “ReachView” app. You should be presented with a screen showing all available Reach units. Since you are connected to a Reach-generated hotspot, the list should only include the one Reach you are connected to:
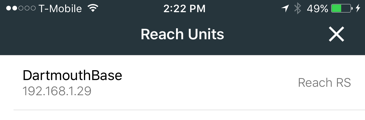
Select this Reach and, after a loading screen, you will arrive at the main ReachView status page for this unit:
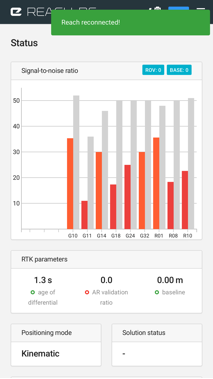
The main status page for the Reach RS
Alternatively, any time you are connected to the internal hotspot in your reach, you can always access the same status page (and all additional ReachView pages) via a web browser by entering 192.168.42.1 in the address bar.
To post process survey data, the only thing we need the base station to be doing is logging data. You do not need to do any other setup besides ensuring that the Reach is recording the appropriate log. In most cases, unless you have changed the default settings, the Reach should begin a new log any time it is turned on. However, it is good practice to check that the log is recording.
Select the “log” tab from the menu.
If using the reachview app on a cell phone or tablet,
the menu is accessed via the “![]() ”
button.
”
button.
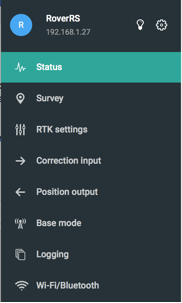
Reachview Menu – Choose “logging”
On the logging page, you should see the following screen:
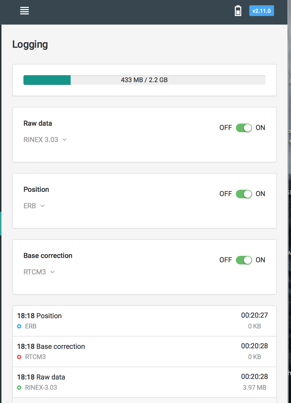
Main logging screen
Ensure that “Raw Data” is enabled and select “Rinex 3.03” as the format. The bar at the top shows how much local storage data is available. And the boxes below show that the device is currently recording 3 types of logs (position, base correction, and Raw Data). The timer at the right shows how long the active log has been recording.
Ideally, if you will need to post process the base station data to establish a base station location, you should allow the Reach to record a log, while sitting over the base station point, for at least 2 hours. Otherwise, the base station needs to be on and logging data for the entire time the rover is on and recording data. So once the base station is on, let it run, uninterrupted, until after the survey is done. Once the survey is done, you can turn off the base station by pressing and holding the power button for a few seconds. The log will be finished and can be downloaded later.
Next, setup the rover to record a log and perform the survey. Unlike using the base and rover in RTK mode, you do not need active communication for this type of Post-Processed Kinematic (PPK) survey, you simply need to ensure that log data is being recorded for the rover as well. Mount your other Reach RS on a GPS survey pole, using the brass adaptor. Be sure to attach the included black LoRa antenna on the bottom of the device. Measure the distance from the tip of the survey pole to the base of the RS (the same spot as you measured to on the base station) and add 65mm. Record this information as the Rover HI (Height of Instrument) for use when post processing the data.
Follow the same steps above that you did for the base station to ensure that the rover is recording a log: Turn on the rover, log into the rover hotspot, open reachview, go to the logging tab, ensure that “Raw Data” is enabled, and select “Rinex 3.03” as the format. Ensure that this screen is showing an active log recording.
Now you should be recording raw satellite observations, as logs, on both the base and rover and you are ready to survey.
You can begin collecting data on the “Survey” page in the ReachView app. The main “survey” page shows you a list of existing survey projects stored in the internal memory of the Reach and allows you to define new projects
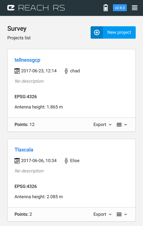
The main “Survey” page in ReachView
Begin a new project by pressing the
![]() button.
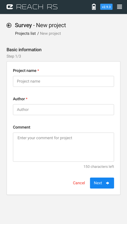
On the following screen, you can enter a name for your project, an author name,
and comments. Enter your information here and press
button.
On the following screen, you can enter a name for your project, an author name,
and comments. Enter your information here and press ![]() .
.
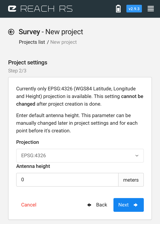
The primary reason we are using the survey app here is so that we create time mark signatures for when each point in our survey is recorded. Therefore, almost none of the settings in the survey setup screen matter. You can, however, enter the Rover HI you recorded earlier under “antenna height” on the second page.
On the 3rd settings page, you can select “auto-save” rules. These rules allow you to automatically record a point you collect if the auto-save conditions are met. Beause we will NOT be intentionally operating in RTK mode, it is better to leave these autosave rules off and record all points manually. Hit “Done”.
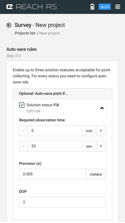
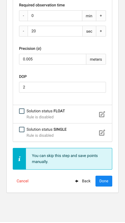
The Autosave Rule Page
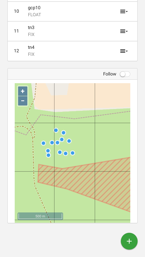
Now you are at the main project overview screen. This page will show you basic info about the project at the top, a list of saved points, and a map of the saved points as well as the current location of the rover and base. If your Reach RS is connected to the internet (via a hotspot on your phone, for instance), it will download some simple base map imagery (as below), otherwise the map will have only a white background.
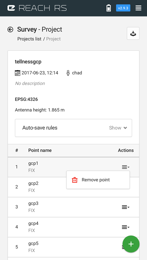
To record a point, press the ![]() button at the bottom of the screen. This will bring you to the “record
point” screen. At the top, you will see basic info about the current state of
the receiver, including “solution” status (fixed, float, single, or “-“), PDOP (Position Dilution of Precision), # of visible
satellites for the base and rover, Age of differential, Ambiguity Resolution
(AR) ratio and the current baseline length (distance between the rover and
base). Because we will NOT be using the coordinates recorded here (we will post
process them) the status data here mostly does not matter. However, you must
have at least “single” as the solution status, or you will not be able to
record a point: there will be a red bar near the bottom of the screen that says
“waiting for solution status” and the “Collect point” button will be greyed out
(as in the image below).
button at the bottom of the screen. This will bring you to the “record
point” screen. At the top, you will see basic info about the current state of
the receiver, including “solution” status (fixed, float, single, or “-“), PDOP (Position Dilution of Precision), # of visible
satellites for the base and rover, Age of differential, Ambiguity Resolution
(AR) ratio and the current baseline length (distance between the rover and
base). Because we will NOT be using the coordinates recorded here (we will post
process them) the status data here mostly does not matter. However, you must
have at least “single” as the solution status, or you will not be able to
record a point: there will be a red bar near the bottom of the screen that says
“waiting for solution status” and the “Collect point” button will be greyed out
(as in the image below).

Survey point collection screen, note the receiver currently has “-“ as the solution status. Point collection is not currently available and the warning bar at the bottom says “waiting for solution status”.
If you are in at least “single” status, and the “collect” button is not greyed out, you may record a point. Place the rod over the point to be recorded. Type a name for the point you wish to collect. Level the survey pole using the spirit level. While keeping the pole level, press the “collect” button. A timer will count up letting you know how long the point has been recorded (allow it to record the point for at least 20 seconds). The screen will display RMS error values that update constantly alongside the latitude, longitude, and height coordinates, however, since we are not in “fixed” status, the error estimates are likely wrong. Continue to hold the survey pole level until more than 20 seconds have passed. Press “Save and Go” to store the point or Cancel to reject it. Move on to the next point you wish to survey and repeat. When all your points have been recorded, turn off the rover to end the log.
4. Downloading logs and reference data
Download
Reach Logs and Files
After returning from the field, when you are ready to download the recorded data, you must download 3 things: the .csv survey file, the rover log and the base log. Turn both units back on and log into the rover via either its wifi hotspot, or via a local router. You probably want to download the data to a computer for post processing, rather than your phone or tablet. The easiest way to do this is to allow the Reach to start its own internal hotspot by turning off any hotspots or routers that it knows. When the Reach boots up, if it does not see a local router, it will start its internal hotspot. Log into that hotspot from a laptop or desktop via wifi (default password is emlidreach). And then open a browser and enter http://192.168.42.1 in the browser bar. This should bring you back to the main status screen. Select “logging” again from the menu.
If you scroll down in the logging screen, you should see all of the previously recorded logs.
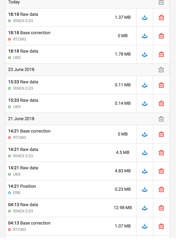
“Logging” screen, showing previously recorded logs
Find the log that corresponds to
the point you collected (based on the date and length of recording) and press
the “![]() ”
button. The log should immediately begin downloading and be saved wherever your
default downloads are stored (i.e. the “downloads” folder in a mac). The
download should end up as a zipped folder (or it may be automatically unzipped
by OSX) called “raw_YEARDATETIME_Rinex-3_03”. If necessary, unzip the folder
using a program
like “7-zip”. This folder should contain two or three files, one with .obs, one with .nav extension, and possible one with .sbs.
These are the files you will need for post processing.
”
button. The log should immediately begin downloading and be saved wherever your
default downloads are stored (i.e. the “downloads” folder in a mac). The
download should end up as a zipped folder (or it may be automatically unzipped
by OSX) called “raw_YEARDATETIME_Rinex-3_03”. If necessary, unzip the folder
using a program
like “7-zip”. This folder should contain two or three files, one with .obs, one with .nav extension, and possible one with .sbs.
These are the files you will need for post processing.
Once you are done downloading the
log, return to the main survey project screen. Go to the survey tab and select
the project you were recording in the field. Export your points using the ![]() button. You will have the option of
downloading your project as GeoJSON, Esri Shapefile, .csv, or DXF. For the post prosessing, select .csv.
button. You will have the option of
downloading your project as GeoJSON, Esri Shapefile, .csv, or DXF. For the post prosessing, select .csv.
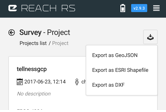
Export dialogue, showing format options
Turn off the rover and log into the base station. Repeat the process above to download the log files from the base station. There is no .csv to download from the base.
Download
Clock and Ephemeris Data
Next you must download precise
ephemeris and clock files for the satellites. You will get increased
accuracy/better probability of a fixed solution if you utilize these files in
the processing below. However, this data
may not be available immediately. “Ultra-rapid” orbit data is available after
~6 hours. “Rapid” orbit data is available after ~17 hours. “Final” orbit data
is available after ~15 days. It is advisable to wait for “Rapid” orbit data,
but may not be necessary to wait for “Final” orbit data.
First, you need to figure out what “GPS Week” and “GPS Day” you need (GPS data is organized by GPS Week and day as to organize time series data into unique numbers).
Surf to this page and find the date of your survey: http://navigationservices.agi.com/GNSSWeb/ When you find the date on the calendar that corresponds to your survey, note the second line in the box for that day. This is the GPS week and day number. For instance, in the screen shot below, a survey on June 5, 2018 would correspond with Week: 2004 day: 2.
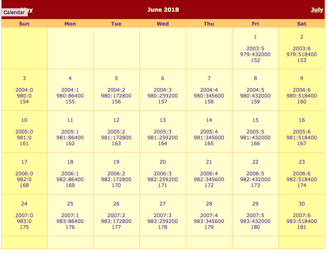
Screen shot of the GPS Date Calendar website
Now you need to go to the IGS data download FTP server. IF you are using a mac, you may just be able to click the following link, and access the FTP site directly: ftp://cddis.gsfc.nasa.gov/gnss/products/ . On a mac, you should be presented with the box below, select “Guest” and hit “connect” and you should get a file browser window showing you all of the IGS data download folders. If you are using a PC or Linux, you likely need to use an FTP app to access this link. You can try a free app like FileZilla (https://filezilla-project.org) and then access the address above also using a “guest” login.
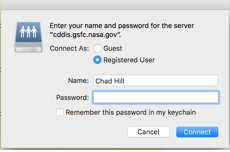
FTP login screen for OSX
Once in the FTP site for the IGS, navigate to the folder that corresponds to the GPS week you just looked up (for instance 2004 for June 5) and open that folder.
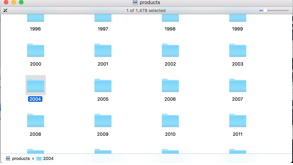
GPS week file folders at the IGS FPT site
If you are downloading data within a few hours of the survey, you will need to download the “ultra rapid” files. These begin with “igu”, if you are downloading data more than 17 hours after your survey, you will download “rapid” files starting with “igr”, and if more than approximately 15 days have passed, you can download “final” files which begin with “igs”. Scroll down in this folder until you find the files that begin with “IGS”, “IGR”, or “IGU”. Find the file that starts with IGS/IGR/IGU, then has the GPS week you noted, followed by the GPS day, followed by the suffix: “.clk.Z”. This is the precise clock data file. In this example that would be: “IGS20042.clk.Z”. Download that file, unzip it, and copy it into the folder with your previously downloaded data. Also find the file that starts with IGS/IGR/IGU, then has the GPS week you noted, followed by the GPS day, followed by the suffix: “.sp3.Z”. This is the precise ephemeris data. Download that file, unzip it, and store it with the previously downloaded data.
If using a mac, you should be able to uncompress the .z extension simply by double clicking it. On a PC, you likely need to download and use a free unzip tool like 7-zip (https://www.7-zip.org).
Download
RTKLib
If you don’t have it already, download the free post processing package “RTKLib”. You should get the version of this software released by Emlid specifically for the Reach units. This can be downloaded for windows here: https://files.emlid.com/RTKLIB/RTKLIB-Win-x64.zip
N.B. : RTKLib will only work in windows or Linux (Linux version here: https://files.emlid.com/RTKLIB/RTKLIB-qt-Linux-x64.zip . If you are using a mac, you must be
using parallels or bootcamp to run windows or linux.
5. Process data in RTKlib
When you download RTKlib, you end up with a folder with several applications in it. The primary two we will use are RTKPost and RTKPlot. Before you begin, ensure that you have the following files ready that you previously downloaded:
1. Base station log observation file ending in “.obs”
2. Base station log navigation file ending in “.nav”
3. Rover log file ending in .obs
4. Precise orbit and clock data ending in .sp3 and .clk
Run RTKPost.exe. You will be presented with this main screen.
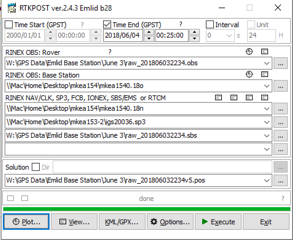
RTKPost main screen
There are primarily two things you have to do to process data in RTKPost: load all of the files in the main screen, and adjust several settings in the “Options” menu.
Begin by going to the Options screen, as some options may limit your ability to select files in the main screen. Press the “options” button at the bottom of the window. You will be presented with a new window with several tabs at the top.
RTKPost “Options” window
You will need to check or change settings on the “Settings 1”, “Settings 2” and “Positions” tabs.
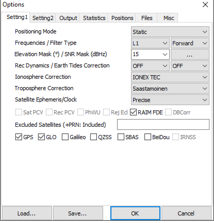
On the “Settings 1” tab, choose “kinematic” for positioning mode. This tells RTKPost that your rover was moving, and all recorded positions are not the same.
Under “Frequencies/Filter Type” select “L1” for frequencies as the Emlid is only able to receive the L1 signals and select “Forward” for “Filter Type”.
For “Elevation Mask” select 15. This is telling RTKPost to ignore any satellite signals that are lower than 15 degrees above the horizon. Signals closer to the horizon suffer from more atmospheric error and are more likely to have multipath error. 15 degrees is a good starting point, but you may want to experiment with raising this number depending on your results (see troubleshooting below).
Turn “Rec Dynamics” on and “Earth Tides Corrections” off. Receiver dynamics estimates the rovers speed and acceleration and attempts to account for that.
For Ionosphere correction choose “Broadcast”. For long baselines, or to improve your result, you can also try “Estimate TEC”.
For troposphere correction choose “Saastamoinen”.
For satellite ephemeris/Clock choose “Precise”.
At the bottom, be sure that “GPS” and “Glo” are checked. This tells RTKPost to use the data received from both the GPS and GLONASS GNSS constellations.
Switch to the “Settings 2” Tab. It should look like this:
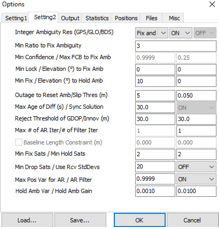
For Integer Ambiguity Res (GPS/GLO/BDS) select “Fix and hold” on the left most drop down and “on” from the middle box.
On the second to last line, ensure that for “Max Pos Var for AR/ AR Filter” the drop down menu on the right is set to “On”.
Switch to the “positions” tab which should look like this:
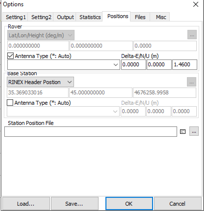
Enable the check box for “Antenna Type”. In the far right box under “Delta-E/N/U (m), enter the height of the instrument (HI) that you recorded in the field. Leave the other boxes at 0.000
In the pull down menu below “Base Station” select “Lat/Lon/Height (deg/m)” or “Lat/Lon/Height (Dms/m)” depending on what format your base station coordinates are in (decimal degrees=“deg/m” or degrees minutes seconds =“dms/m)”. You must enter base station coordinates here. If you don’t already have coordinates for your base station, go back to guide #3 and process your base station log to get a coordinate.
Hit OK to close the options window and return to the main screen.
Load your files in the main
screen. Under “RINEX OBS: Rover”, click the “![]() ”
icon at the right and then select your rover log observation file ending in .obs.
”
icon at the right and then select your rover log observation file ending in .obs.
![]()
The Rover data input area
Next, click the “![]() ”
to the right of “RINEX OBS: Base Station”. Select the observation file from
your base station also ending in .obs.
”
to the right of “RINEX OBS: Base Station”. Select the observation file from
your base station also ending in .obs.
Next, press the first “![]() ”
below “RINEX NAV/CLK/, SP3, FCB, IONEX, SBS/EMS, or RTCM”. Select the .nav file from your Emlid base station log.
”
below “RINEX NAV/CLK/, SP3, FCB, IONEX, SBS/EMS, or RTCM”. Select the .nav file from your Emlid base station log.
Press the second “![]() ”
below “RINEX NAV/CLK/, SP3, FCB, IONEX, SBS/EMS, or RTCM”. Select the .sp3 file from you downloaded with your CORS data.
”
below “RINEX NAV/CLK/, SP3, FCB, IONEX, SBS/EMS, or RTCM”. Select the .sp3 file from you downloaded with your CORS data.
Press the third “![]() ”
below “RINEX NAV/CLK/, SP3, FCB, IONEX, SBS/EMS, or RTCM”. Select the .clk file you downloaded from
the IGS FTP server.
”
below “RINEX NAV/CLK/, SP3, FCB, IONEX, SBS/EMS, or RTCM”. Select the .clk file you downloaded from
the IGS FTP server.
Select a location for your results
to be saved under “solution”. RTKPost will default to
storing your results in a file ending in “.pos” with the same name and in the same folder as
the file selected under “RINEX OBS: Rover”. You can select a new folder by
clicking the “![]() ”
button, or you can edit the file name directly in the text box.
”
button, or you can edit the file name directly in the text box.
![]()
You SHOULD now be ready to process your baseline location. Press the “Execute” button and you should see a green progress bar along the bottom of the window. Depending on the options you selected and the length of your log file, it may take several minutes for processing to be completed.
6. Check Your Solution
Once the processing is finished (you should see the message “done” at the bottom of the main window) you can press the “plot” button to run RTKPlot and open the solution. It will open a window that looks like this, where you can see an XY plot of a track of the receiver moving during your observation:
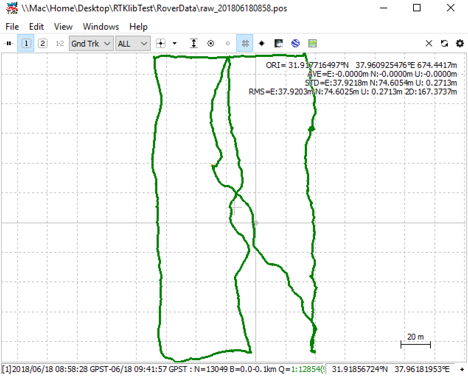
RTKPlot window showing processing solution
When RTKPost processes the data, it assigns a quality value to each epoch (single recorded observation) of data. RTKPlot displays the horizontal position of each epoch of processed data and identifies it with a color corresponding to the quality value. In your RTKPlot window, then, you should see hundreds or thousands of dots of various colors. In this context each point in the window should be one of 3 colors: Red, Yellow, and Green. Red indicates that the epoch had a “single” solution meaning no correction was applied. Yellow is a “float” solution, meaning differential correction was applied, but the “integer ambiguity” problem was not solved. Green is a “fixed” position and means the integer ambiguity problem was solved. A “good” processing result is a majority of green dots.
You can see the proportion of fixed, float and single epochs in the bottom right of the window where it shows “Q=XXXXXXXXXXXX”. In the above result 98.5% of the epochs were fixed and 1.5% were float (the %s are partially obscured in the screenshot). This is a good result.
Creating a table of survey results
Next, open the “.pos” file, generated by RTKPost, in a text editor. This file is written wherever was specified in the “solution” line in RTKPost above, though the default is the same folder as the Rover .obs file. The beginning of the .pos file should look similar to this:
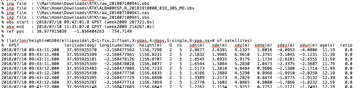
.Pos file opened in a text editor
This text file will show you, line by line, each epoch (individual record) of solution data. Columns 3, 4, and 5 show latitude, longitude and ellipsoid height. Column 6 shows the quality flag for the epoch, i.e. 1=fixed, 2=float, 5=single (uncorrected).
In this long list are the epochs you recorded when your rover was over the points you were surveying. To find them, open the .csv file, in a spreadsheet program like excel. Your .csv should look like this:
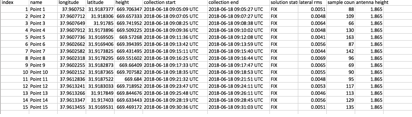
Each line in the spreadsheet is one point recorded in the survey (the name given for the point is listed in column 2). The 6th and 7th columns show the start and end time for the point. “Point 1” in the example above started at 9:05:09 on June 6, 2018 and ended at 9:05:27 on the same day. The longitude and latitude data in columns 3 and 4 are the positions the Reach recorded in the field, and the solution status is listed in column 8. In this example, although the solution status is listed as “FIX”, because the Reach was operating in RTK mode, the data is not good because the base station was not operating with a known coordinate. So the positions in column 3, 4, and 5 are wrong and will be replaced by good points from the .pos file. In the .pos file, scroll down until you get to the same time stamp range as listed in the “collection start” and “collection end” time range in the .csv file:
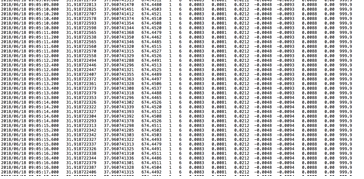
Part of the .pos file showing the time range for “point 1” in the .csv shown above: 9:05:09 to 9:05:27.
Theoretically, any line with quality tag “1” (for “Fixed”) in the 6th column during the recording window indicated by the “Collection start” and “collection end period should be a valid location for this point and should only vary by as much as the rod moved during recording (there are ways to check this). Create 3 new columns in your .csv spreadsheet called “PPKLat”, “PPKLon”, and “PPKHeight”. Copy the lat, lon, and height values (columns 3, 4, and 5) from one line during the correct time range for the first survey point into the new “PPKLat” “PPK Lon” and “ppk Height” columns for that point in the .csv file.
Repeat this for each record in the .csv. This is, currently, the best way to get the results into a useable format, even though the copy/paste process is tedious.
7. Troubleshooting:
Although powerful, free, and open source, RTKLib is not a particularly beginner friendly software package. The user manual is dense and the Graphical User Interface is deceptively simple. RTKPost can fail or give poor results with no clear indication of what went wrong. This can be exceedingly frustrating. The final section in this walkthrough provides a FEW suggestions for how to correct common problems or improve poor results when trying to post-process Emlid log data.
1. When you hit execute, watch the progress bar along the bottom. The info bar will show the quality of each solution, in real-time, as it is processed. This will give you some indication of how the process is going. If you see that all of the quality flags are “0”, this means “no solution data”:
![]()
RTKPost status bar showing “Q=0”.
If the process completes and you
hit the “plot” button, RTKPost will open and no data
will be displayed along with the phrase “No solution data” at the bottom left.
If you are getting all “0” and “No solution data”, you are missing some data
somewhere. The most likely culprit is that the time span of your Rover data
(the Emlid log) does NOT overlap with the base station log or you did not
select the appropriate .obs,
and .nav files. The easy way to check this is to hit
the “![]() ”
icon to the right of both the “RINEX OBS: Rover” and “RINEX OBS: Base” lines in
the main RTKPost window. This will open two separate RTKPlot windows showing the raw observation data from the
base station and the rover.
”
icon to the right of both the “RINEX OBS: Rover” and “RINEX OBS: Base” lines in
the main RTKPost window. This will open two separate RTKPlot windows showing the raw observation data from the
base station and the rover.
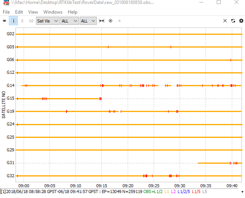
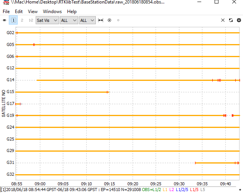
RTKPlot for the observation log from an Emlid Reach RS acting as rover (Top) and base station (bottom). Note the overlapping time spans along the bottom of each window.
The information box in the bottom left corner of each window shows you the start and end time for the file. Ensure that the total time span of the base station data contains the time span of the log data from the rover. In the case above, the rover data spans June 18, 2018 8:58am – 9:41am. Meanwhile, the base station data file spans beyond the entire rover period from June 18, 2018 8:54am to 9:43am. There is sufficient overlap for post-processing. N.B. the times in both windows will be reported as GPS time which is equivalent to Greenwich Mean Time (GMT) or Universal Coordinated Time (UTC).
2. More insidious is the case where the processing runs, but rather than a nice clustering of mostly green “Fixed” (q=1) flags, you get mostly or all yellow “float” solutions (Q=2). Float solutions can be off by as much or more than uncorrected “single” solutions, and should not be relied upon to provide an accurate location for your surveyed points. Instead you should try adjusting one of several settings to see if you can increase the percentage of fixed solutions:
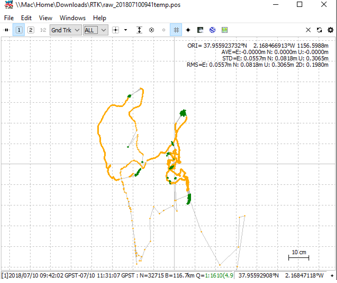
RTKPlot of a solution file showing small percentage of fixed epochs (4.9%).
First, try adjusting the elevation
mask and signal-to-noise ratio (SNR) masks found on the “Settings 1” tab of the
“Options” menu. The default elevation mask is 15 degrees above the horizon.
However, slowly raising this number (and discarding satellite data from higher
on the horizon) can improve the results until you reach a point at which too
many signals are excluded and the result degrades. Try changing the elevation
mask to 20 and processing again to see if the result improves. Additionally,
try turning on SNR masks. Press the “![]() ”icon
to the right of “Elevation Mask/SNR Mask” which opens this window:
”icon
to the right of “Elevation Mask/SNR Mask” which opens this window:
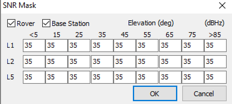
SNR Mask window in RTKPost
Ensure that “Rover” and “Base Station” are checked. Leave all the values at their default of 35. Re-run your processing and see if the result improves.
If you used the default settings
listed above, you may also try changing the Ionosphere correction to “Estimate
TEC” which is likely to work better than
“broadcast” for longer baselines. You can also download actual Ionosphere data
models to use in the processing which may help increase the quality of the
result, though the latency for ionosphere data is similar to
that for clock and ephemeris data. Data can be downloaded here and then added
to the file selection window in RTKPost:https://cddis.nasa.gov/Data_and_Derived_Products/GNSS/atmospheric_products.html
If you download ionosphere data from this site, you would add it to the file selection window in RTKPost (.18i extension file), and then select “IONEX Tec” from the “ionosphere” pulldown menu in the Settings 1 tab of the options window.
You can TRY running the processing with alternative settings for “Integer Ambiguity Resolution (first line of “Settings2” page in “Options” menu. Try turning Glonass Ambiguity Resolution to Fix and hold (the middle of 3 dropdown menus to the right of “Integer Ambiguity Res (GPS/FLO/BDS”. Or try turning Glonass AR off and try GPS (first dropdown) as “Continuous”.
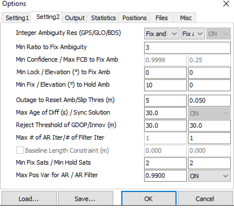
“Settings2” in the options menu of RTKpost
Lastly, you might try running the process both forwards and backwards. Under “options”, on the “settings 1” tab, select “combine” from the pulldown menu for “filter type”. Running the processing with this setting gives you more chances to get a fixed solution for each epoch (if using “Fix and hold” for “Integer Ambiguity Res” on page 2. This step can also help to filter out some bad data that was incorrectly flagged as “fixed” in forward only processing.